Reuters
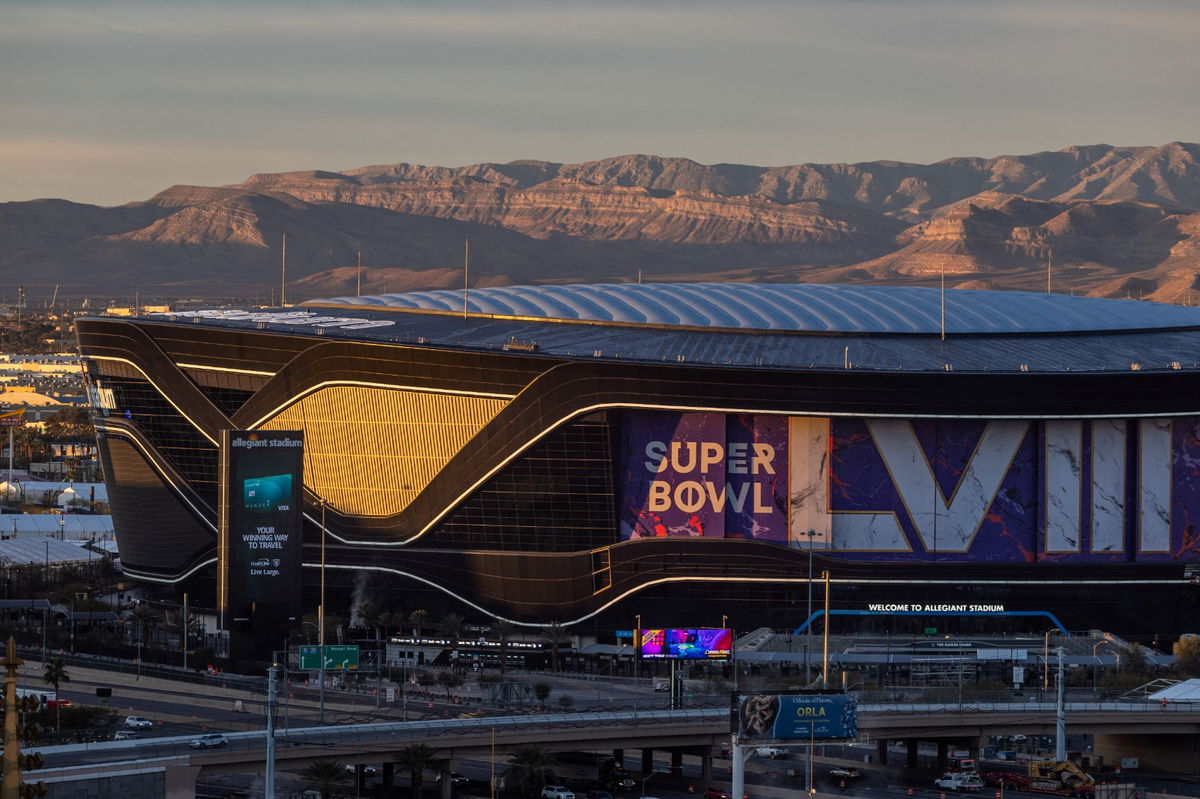
The rising sun illuminates the Allegiant Stadium, where Super Bowl LVIII will take place, in Las Vegas, Nevada, U.S., January 24, 2024. REUTERS/Carlos Barria

Reuters
The rising sun illuminates the Allegiant Stadium, where Super Bowl LVIII will take place, in Las Vegas, Nevada, U.S., January 24, 2024. REUTERS/Carlos Barria
The Super Bowl is no less than a holiday for the football enthusiasts. Taking place at the Allegiant Stadium this time around, the event appears to be grander than ever before. Subsequently, attendance at the Super Bowl might not be as pocket-friendly as its previous seasons. With an average price of a ticket around $7.5k-$10k, the NFL seems to have taken the season end to the next level this year. However, it all comes down to the changes that have been witnessed in the expenditure trends, especially this season.
Watch What’s Trending Now!
In the wake of this upcoming event hosted at the “Death Star”, we will take a look at past spending traditions and how they have changed over the years. These hyped prices seem to have numerous reasons behind them, particularly with the arrangements being put forth by the National Football League for the biggest game of the 2023 season.
ADVERTISEMENT
The Super Bowl expenditure trends this year
Organizations like the National Retail Federation and Statista have been compiling the Super Bowl Data over the years and have come up with some interesting analyses of the money that comes in and out of the event. According to the NRF, more than 200 million people plan to watch the Super Bowl in 2024. A lot of people plan to attend a Super Bowl party, or even throw one of their own. Potentially for this, even the league has its preparations done right.
Imago
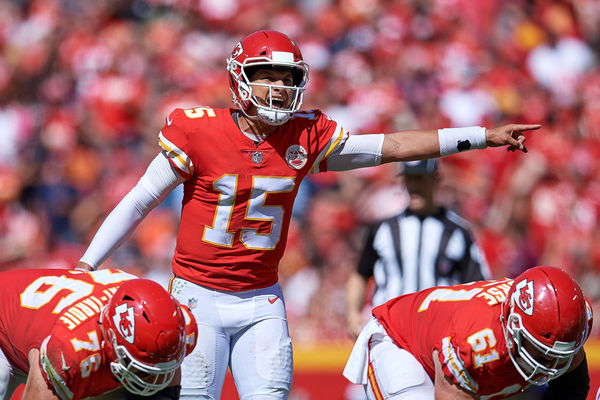
KANSAS CITY, MO – SEPTEMBER 23: Kansas City Chiefs quarterback Patrick Mahomes (15) calls a play in action during an NFL American Football Herren USA game between the San Francisco 49ers and the Kansas City Chiefs on September 23, 2018, at Arrowhead Stadium in Kansas City, MO. (Photo by Robin Alam/Icon Sportswire) NFL: SEP 23 49ers at Chiefs PUBLICATIONxINxGERxSUIxAUTxHUNxRUSxSWExNORxDENxONLY Icon164180923229
The report from NRF points out that this year around, the Super Bowl expenditures are expected to cross the $17 billion mark easily. While 80% of this expenditure is on Food and Beverage services, commodities like apparel, TVs, decorations, and furniture also have a significant holding of 20%. Also, we cannot forget about people going to pubs and bars to watch the Super Bowl LVIII. This survey involved more than 8,000 people and had an error margin of plus or minus 1%.
ADVERTISEMENT
According to the report, it was pointed out that people are expected to spend a minimum of $86.04 for the Super Bowl party. The report also states that watching this game is important for 44% of the viewers, while 19% of the people give the most importance to the Halftime show, awaiting the performance by Usher.
Top Stories
NFL Makes Final Punishment Decision on Shedeur Sanders Incident in Week 17

Chiefs Coach Abruptly Leaves Andy Reid’s Staff Amid Titans’ Rumored Interest in Matt Nagy

Jerry Jones Finally Acknowledges the Dak Prescott Gamble Hasn’t Paid Off; Confirms Painful Changes Ahead for Cowboys

NFL Announces Double Punishment on Incidents Against Josh Allen’s Bills

Sources: John Harbaugh-Lamar Jackson Rift Growing as Ravens HC Could Exit in 2026; Plus Mike Tomlin Update
ADVERTISEMENT
How the trend has evolved over the years?
This is a Déjà vu kind of a situation on all fronts for the football world. The most money ever spent on Super Bowl before this year was in 2020 when the Kansas City Chiefs went against the San Francisco 49ers. The recorded revenue was around $17.2 billion. 3 years later we are back to square one.
The same match-up is going to take place in Vegas and people are expected to spill out about $17.3 billion. Compared to 2007, this is approximately a 50% increase in revenue. In 2007, the revenue was $8.7 billion and worked its way to $15.5 billion in 2015 and the rest is history.
ADVERTISEMENT
Getty
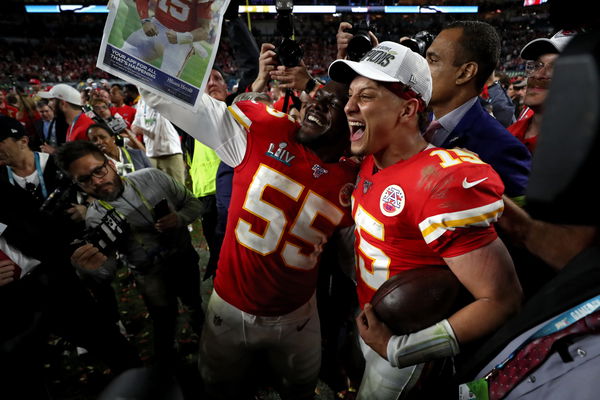
MIAMI, FLORIDA – FEBRUARY 02: Patrick Mahomes #15 of the Kansas City Chiefs reacts after defeating San Francisco 49ers by 31 – 20 in Super Bowl LIV at Hard Rock Stadium on February 02, 2020 in Miami, Florida. (Photo by Jamie Squire/Getty Images)
While the individual spending data, according to Statista, precedes back to 2011. It shows that individual spending in 2011 SB was $59.33 and went to $82.19 in 2016. The spending found a surge in 2020, with $88.65 per person (Chiefs vs Niners game), and it came back to $86.04 this year.
In SB LVII, the NFL generated a revenue stream of about $14 billion in ticket sales, merch sales, ads, and F&B. Another $5.6 million per commercial for a 30-second slot. Then there was about $100 million worth of sales of the SB merchandise. More than $700 million was spent in the state of Arizona on various businesses like security, travel, and other local businesses.
ADVERTISEMENT
What do you think of the extravagant expenditure that is entering the football dynamics? Let us know your thoughts below.
Watch this story: Coach Jim Harbaugh Sets The Record Straight On Michigan’s Sign-Stealing Incident
ADVERTISEMENT
ADVERTISEMENT
ADVERTISEMENT

