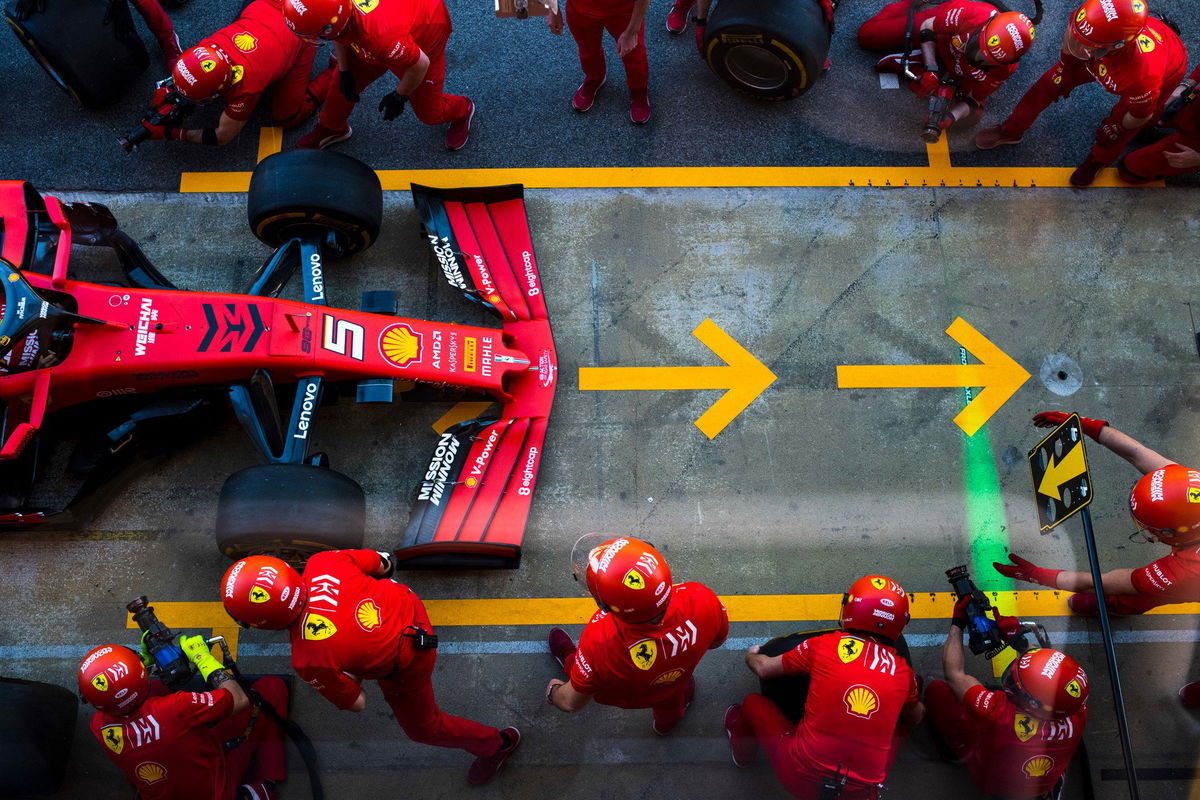

Sometime ago, there were a number of complaints about the Ferrari power unit from multiple teams. Naturally, this prompted an FIA investigation into the matter to search for foul play or to allay any fears.
Watch What’s Trending Now!
According to RaceFans’ Dieter Rencken, the investigation debunked one theory about the team’s sudden superior engine performance. First and foremost, there was the tyre situation. Secondly, some felt that Ferrari were eking out performance by ‘leaking’ intercooler fluid into the engine.
According to a race official to Rencken, the FIA inspected the system with the full co-operation of Ferrari. According to their analysis, there were no visible areas within the system from which fluids could leak. Instead, it transpired that three vastly different liquids were integrated into the cooling system.
ADVERTISEMENT
However, the question of how Ferrari is achieving its insane power output remains 2019’s biggest mystery. This is a question that the Maranello outfit’s rivals keenly want an answer to. This is because they are eager to bridge the abyss between them before the 2020 Formula One season begins.
"They tell me that after the FIA inspected the system with the full co-operation of Ferrari, there were no discernible high pressure points within the system from which fluids could leak. Three distinctly different liquids are used for cooling." https://t.co/jOc2u1uFL5
— tami. (@Vetteleclerc) October 28, 2019
Speaking to Dean Locke, F1’s director of broadcasting, RaceFans learned the methodology and philosophies behind the graphics. The FIA adopted a new set of tyre graphics, in the wake of complaints from Pirelli.
ADVERTISEMENT
The graphic, that was first used in Suzuka, displays percentage values representing the ‘condition’ of each tyre on a driver’s car.
In fact, Pirelli motorsport director Mario Isola was “surprised” by its sudden appearance in Japan. He confirmed that Pirelli was not consulted during the conception of the system. To that end, he raised concerns about the potentiality of the data being “misleading”.
ADVERTISEMENT
So, the FIA released a statement before the Mexican Grand Prix 2019. It assured that the Tyre Performance graphic had been “improved” since the Japanese Grand Prix. They also said that the graphic provides “detailed, real-time information on the current condition for all four individual tyres on a chosen car, presented as a percentage value on a scale between ‘new tyre with no wear’ (100%) and a ‘used tyre’ at the end of its effective performance lifespan (0%).
“The % value indicates how much of the tyre performance capability has been used thus far into the stint; this value is not to be confused with tyre wear which instead refers to the amount of actual rubber removed from the tyre during the usage period. Lower values indicate a proportional loss in tyre performance via tyre degradation.”
ADVERTISEMENT

ADVERTISEMENT
ADVERTISEMENT
ADVERTISEMENT

